[浏览完整版]
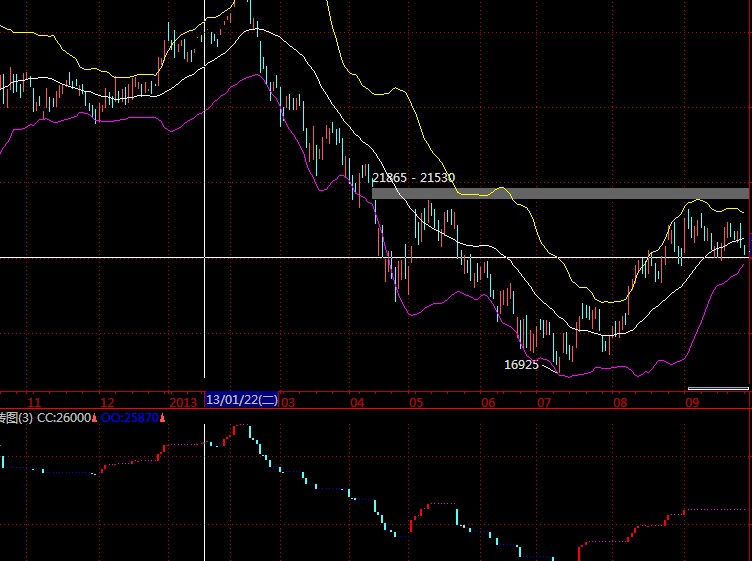
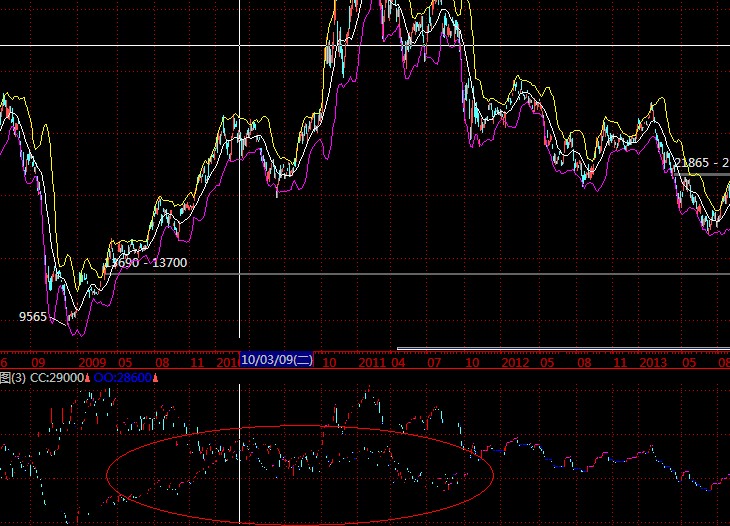
标题:附图为什么一缩时间轴,图形就变形了
1楼
a7088044 发表于:2013/9/30 14:48:422楼
lichenghu 发表于:2013/9/30 14:50:12副图是和主图关联的,缩时间轴主图就变化,相应副图也会变化。
3楼
a7088044 发表于:2013/9/30 14:53:26可是俩个月之内的数据,显示的没问题。
为什么一缩了,就乱了??
附图是三价反转图,算法没有问题。。
4楼
lichenghu 发表于:2013/9/30 14:58:271,看下主图对应的数据有没有问题,或者换个品种看看
2,如果主图数据没有问题只能说明副图指标有问题,自行分析下
5楼
a7088044 发表于:2013/9/30 15:13:27换了品种也存在这个问题。。
我又试了一下,我先把主图缩放好后,附图删除了,重新加载一边后,正常了。然后动一下时间轴,就又变形了!
6楼
lichenghu 发表于:2013/9/30 15:14:50 那就是说明您代码有问题,换个代码试试,看下有没有这个问题。分析下源码
7楼
RogarZ 发表于:2013/9/30 15:15:48你叠加的什么公式?
有跨周期引用?
查查相应的数据吧
8楼
a7088044 发表于:2013/9/30 15:33:06input:m(3,2,9999); //参数M定位,第1根TBL柱线对应K线的序号
if m<2 then exit;
up:=c>ref(c,1);
down:=c<ref(c,1);
fc:=close;
fo:=open;
a:=setlbound(up,1);
up[1]:=fc[1]>fo[1];
n:=m-1;
if up[n] then begin
B4:=fc[n];
B1:=fo[n];
b3:=B1;
B2:=B1;
tbl:=1;
end else begin
B4:=fo[n];
B1:=fc[n];
B2:=B4;
B3:=B4;
tbl:=0;
end;
tblcount:=1;
////////////////////////////////////
for i=n+1 to datacount do begin
if tbl=1 then begin
if up[i] then begin
if fc[i]>B4 then begin
tblcount:=tblcount+1;
tblc[i]:=fc[i];
tblo[i]:=B4;
if tblcount>2 then begin
tblcount:=3;
B1:=B2;
B2:=B3;
end;
B3:=B4;
B4:=fc[i];
end;
end
else if down[i] then begin
if fc[i]<B1 then begin
tblcount:=1;
tblc[i]:=fc[i];
tblo[i]:=B3;
B1:=fc[i];
B2:=B3;
tbl:=0;
end;
end;
end else begin
if down[i] then begin
if fc[i]<B1 then begin
tblcount:=tblcount+1;
tblc[i]:=fc[i];
tblo[i]:=B1;
if tblcount>2 then begin
tblcount:=3;
B4:=B3;
b3:=B2;
end;
B2:=B1;
B1:=fc[i];
end;
end
else if up[i] then begin
if fc[i]>B4 then begin
tblcount:=1;
tblc[i]:=fc[i];
tblo[i]:=B2;
B4:=fc[i];
B3:=B2;
tbl:=1;
end;
end;
end;
end;
stickline(tblc<>0 and up,tblc,tblo,7,1)colorred;
stickline(tblc<>0 and down,tblc,tblo,7,0),colorcyan;
ts:=barslast(tblc);
stickline(tblc=0 and ref(up,ts),ref(tblc,ts),ref(tblc,ts),3,1),colormagenta;
stickline(tblc=0 and ref(down,ts),ref(tblc,ts),ref(tblc,ts),3,1),colorblue;
cc:tblc,linethick0;
oo:tblo,linethick0;
9楼
lichenghu 发表于:2013/9/30 15:35:56您仔细看看吧,对应每跟K线都有值而且没有叠加情况。
这个就是您指标当时的返回值,自行分析
[此贴子已经被作者于2013/9/30 15:36:07编辑过]
10楼
a7088044 发表于:2013/9/30 15:50:38哪个是我指标的返回值???
图片看不见啊
 此主题相关图片如下:4422.jpg
