共6 条记录, 每页显示 10 条, 页签:
[1]
[浏览完整版]
标题:如何不用VBA实现等价k线
1楼
leelatan 发表于:2016/7/10 22:24:35等价k线的实现,之前看到的帖子似乎都要用到vba。
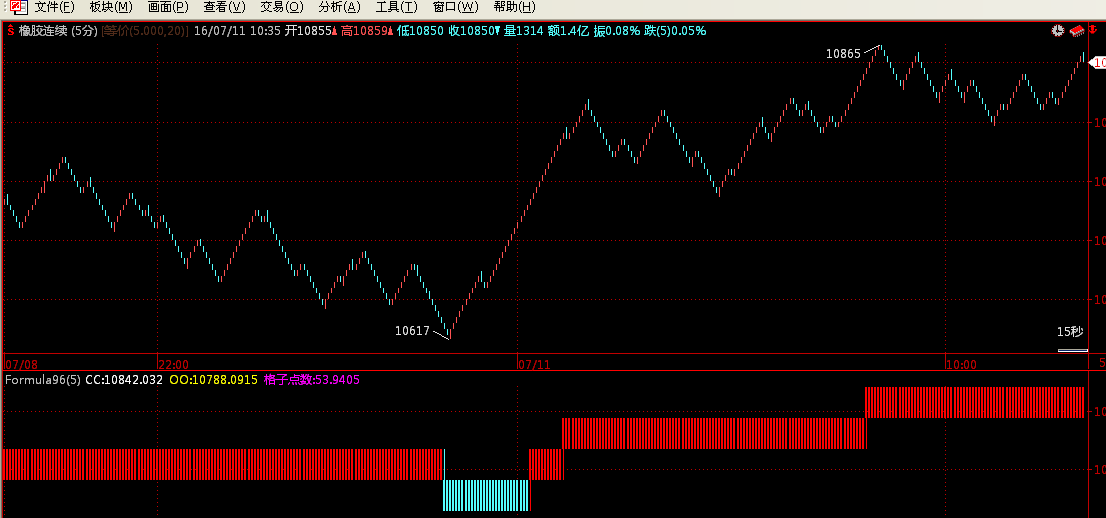
如何在普通的图表上显示等价k线?终于找到一段代码,可以在金字塔副图正常显示。
请版主看下,这样实现出来的等价K线是否准确。有没有未来数据?
INPUT:N(5,1,100);
fc:=c;fo:=o;cc:0*c,PRECISION4,LINETHICK0;oo:0*c,PRECISION4,LINETHICK0;t1:=0*c;t2:=0*c;
for i=1 to datacount do begin
if i=1 and fc[i]>fo[i] then
cc[i]:=fc[i];
oo[i]:=fc[i];
if i=1 and fc[i]<fo[i] then
cc[i]:=fc[i];
oo[i]:=fc[i];
if i>1 then
cc[i]:=cc[i-1];
oo[i]:=oo[i-1];
if i>1 and fc[i]>cc[i]*(1+n/1000) then begin
cc[i]:=cc[i-1]*(1+n/1000);
oo[i]:=cc[i-1];
end;
if i>1 and fc[i]<oo[i]/(1+n/1000) then begin
oo[i]:=oo[i-1]/(1+n/1000);
cc[i]:=oo[i-1];
end;
if oo[i]=oo[i-1] then
t1[i]:=t1[i-1]+1;
if cc[i]=cc[i-1] then
t2[i]:=t2[i-1]+1;
end;
o1:=ref(oo,t1+1);
c1:=ref(cc,t2+1);
格子点数:abs(cc-oo),PRECISION4,linethick0;
STICKLINE(c1=oo,ref(cc,1),ref(oo,1),1,1)COLORRED;
STICKLINE(c1=oo,cc,oo,8,1)COLORRED;
STICKLINE(o1=cc,ref(cc,1),ref(oo,1),1,1)COLORCYAN;
STICKLINE(o1=cc,cc,oo,8,1)COLORCYAN;
[此贴子已经被作者于2016-7-10 22:26:13编辑过]
2楼
jinzhe 发表于:2016/7/11 9:48:59这里设置的价差是多少?
3楼
leelatan 发表于:2016/7/11 10:28:06就是那个参数n,5代表千分之5。
不过感觉这个写法好像有未来数据,尤其在有巨大跳空缺口的时候。
麻烦帮测试一下?
4楼
jinzhe 发表于:2016/7/11 10:34:315楼
leelatan 发表于:2016/7/11 10:49:27用vba实现的等价k线主图上,可以做程序化交易吗
6楼
jinzhe 发表于:2016/7/11 11:02:53不行,等价图不能用来做交易
共6 条记录, 每页显示 10 条, 页签:
[1]
 此主题相关图片如下:1.png