标题:资金K线图制作
制作的思路是什么?要日线图还是分钟图?开高低收怎么定义?
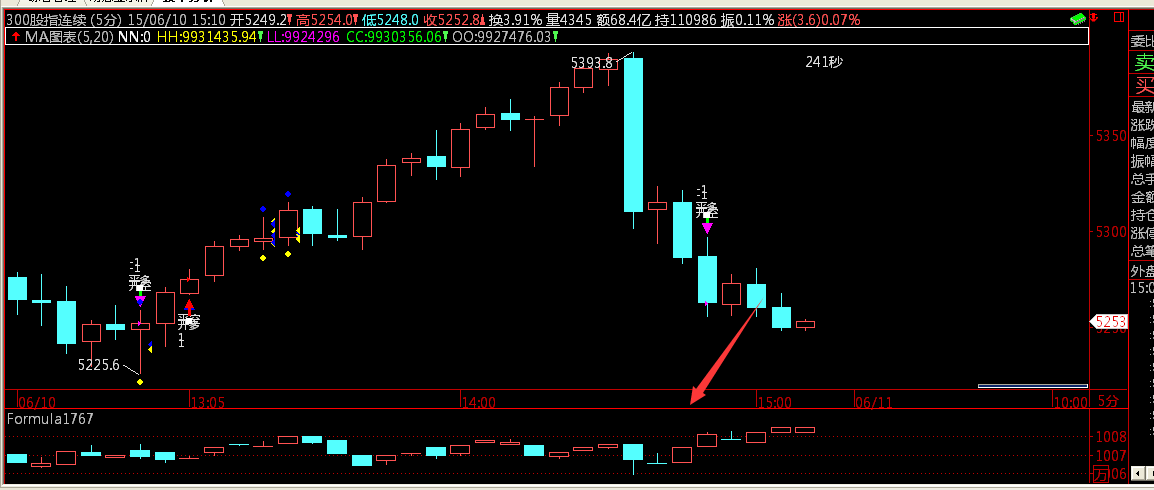
在5分钟上制作资金k线图
则需要如下操作
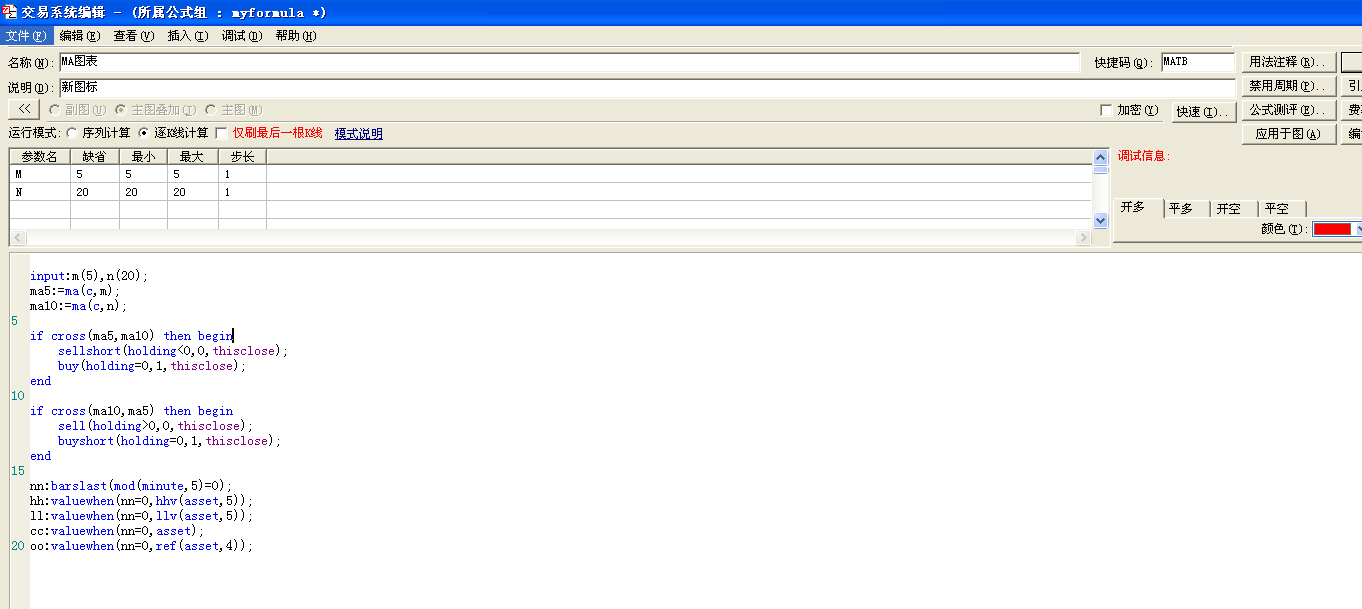
现在原来的交易公式里面添加如下代码:
input:m(5),n(20);
ma5:=ma(c,m);
ma10:=ma(c,n);
if cross(ma5,ma10) then begin
sellshort(holding<0,0,thisclose);
buy(holding=0,1,thisclose);
end
if cross(ma10,ma5) then begin
sell(holding>0,0,thisclose);
buyshort(holding=0,1,thisclose);
end
nn:barslast(mod(minute,5)=0);
hh:valuewhen(nn=0,hhv(asset,5));
ll:valuewhen(nn=0,llv(asset,5));
cc:valuewhen(nn=0,asset);
oo:valuewhen(nn=0,ref(asset,4));
 此主题相关图片如下:1.png
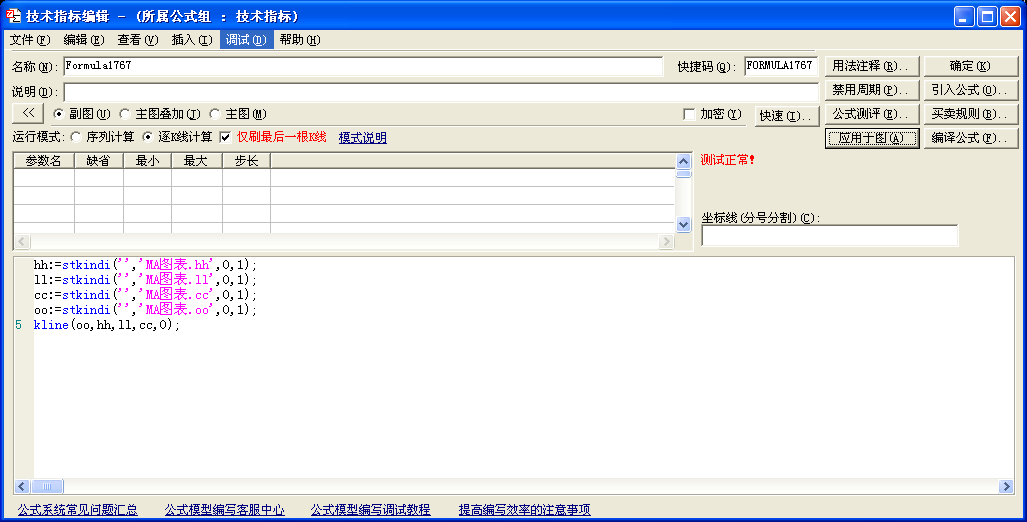
然后制作k线图的代码公式,代码如下
hh:=stkindi('','MA图表.hh',0,1);
ll:=stkindi('','MA图表.ll',0,1);
cc:=stkindi('','MA图表.cc',0,1);
oo:=stkindi('','MA图表.oo',0,1);
kline(oo,hh,ll,cc,0);
 此主题相关图片如下:2.png
然后制作k线图的代码公式,代码如下
hh:=stkindi('','MA图表.hh',0,1);
ll:=stkindi('','MA图表.ll',0,1);
cc:=stkindi('','MA图表.cc',0,1);
oo:=stkindi('','MA图表.oo',0,1);
kline(oo,hh,ll,cc,0);
上面是引用1分钟周期的MA图表公式中资产在5分钟模数的开高低收值,这样有问题吧?因为1分钟周期的资产不同于5分钟周期,这样得到的资金K线不是5分钟的。
